In 2020, 15% of families with children ages 0-12, had an income below Statistics Canada’s Low-Income Measure After Tax (LIM-AT) as compared to 25% in 2015. This reduction is largely attributed to the Canadian Federal Government’s introduction of temporary income support measures during the COVID-19 pandemic. These measures were intended to offset losses in employment income. As a result, Canadians experienced an accelerated growth of after-tax household income, particularly amongst lower-income families and families with children. Approximately 15.5% of all Torontonians’ income came from government transfers such as the Canada Emergency Response Benefit (CERB), the Canada Recovery Benefit (CRB), and permanent transfers including GST/HST credits and the Canada Child Benefit (CCB). [1]
After careful analysis, it was determined the 2021 census data should be used in the calculation of the Child & Family Inequities Score and be interpreted with caution due to the influence of temporary pandemic support measures.
The rationale for this decision is below:
The absence of alternative data sources:
The T1 Family File (T1FF) is an annual tax filer income database that would not suffice as an alternative data source for estimating low-income in the Score due to the incomparable size of its population and geography misalignment. Even though more recent data is available from the T1FF, it is not a viable alternative data source for these, and other reasons listed below. Furthermore, combining information from the Census and the T1FF raises methodological concerns as the T1FF does not contain all the information required to calculate the scores.
1. Difference in the applicable population: On T1FF, anyone who files their taxes, and their dependents are in scope, regardless of where they live. On the census, the location of a respondent is based on their principal residence and includes only individuals living in private dwellings.
2. The main unit of analysis: The T1FF uses census family unit while the Census uses household.[2] This triggers a misalignment of the family structure breakdowns used in the Child & Family Inequities Score.
3. Calculation of the LIM on the Census is based on household (LIM-AT) while it is based on the census family in T1FF (CFLIM-AT):
a. Internationally, researchers tend to use household-based low-income measures since it takes into consideration the sharing of the resources by people living together regardless of their relationship.
b. All previous updates of the score used LIM based on households.
c. While this distinction yields higher low-income rates, trends between the two data sources are comparable. [3]
4. Geographic misalignment: The custom neighbourhood geographies that Statistics Canada uploaded to the Census database are not directly transferrable to the taxfiler database, which uses postal codes as the building block. This would cause neighbourhood boundaries to misalign.
a. Furthermore, combining data using a different methodology to assign geography could lead to inconsistencies between the various indicators used to calculate the score.
b. Additionally, while the Census is interested in the location of the principal residence, the T1FF uses the information provided by the tax filer to the Canada Revenue Agency to assign a geography.
5. Consistency of data sources: Keeping sources and methodology the same across updates of the Child & Family Inequities Score is also a priority.
An alternative option is to continue to use 2016 Census data which uses the 2015 tax filer data. However, this dataset is almost 10 years old and does not reflect the significant increases to the CCB which started in July 2016.
Permanent increase to CCB will continue to drive a decrease in poverty:
Based on data from the Census of Population, the low-income rate in Toronto’s families with children aged 0-12 decreased from 25% in 2015 to 15% in 2020, a 42% decrease.
A substantial decrease in poverty was driven by additional government transfers during this period, most significantly through temporary pandemic relief such as CERB but also with permanent increases to the Canada Child Benefit (CCB). This permanent increase to the CCB helped to increase families income above the poverty line. The CCB was implemented in 2016 and is a tax-free income support program targeting low- and middle-income families, to assist with the cost of raising children.
Studies have shown that children in families near the higher-end threshold of low-income were more likely to be bumped above the poverty line by the CCB. However, children in families that were at a much lower income level did not see the same benefit.[4] Therefore, families experiencing deeper poverty did not benefit enough from the CCB.
Given that pandemic-related benefits were temporary, Statistics Canada will continue to examine poverty trends during the post-pandemic period to determine if the low poverty rates observed in 2020 will be sustained into the future. This is important in the context of record-low unemployment and excessive inflation. Although much of the decrease in poverty is due to temporary measures, it is likely that the permanent increase to the CCB will provide lasting improvements in the level of poverty among families.
The homogenous effect of income growth across families:
On average, Toronto neighbourhoods experienced a 10-percentage point decrease in low-income families. Of all Toronto neighbourhoods, 99% saw a decrease or no change in percent low-income families, while 2 neighbourhoods saw a 1-percentage point increase in low-income families.
The relative and composite nature of the Child & Family Inequities Score:
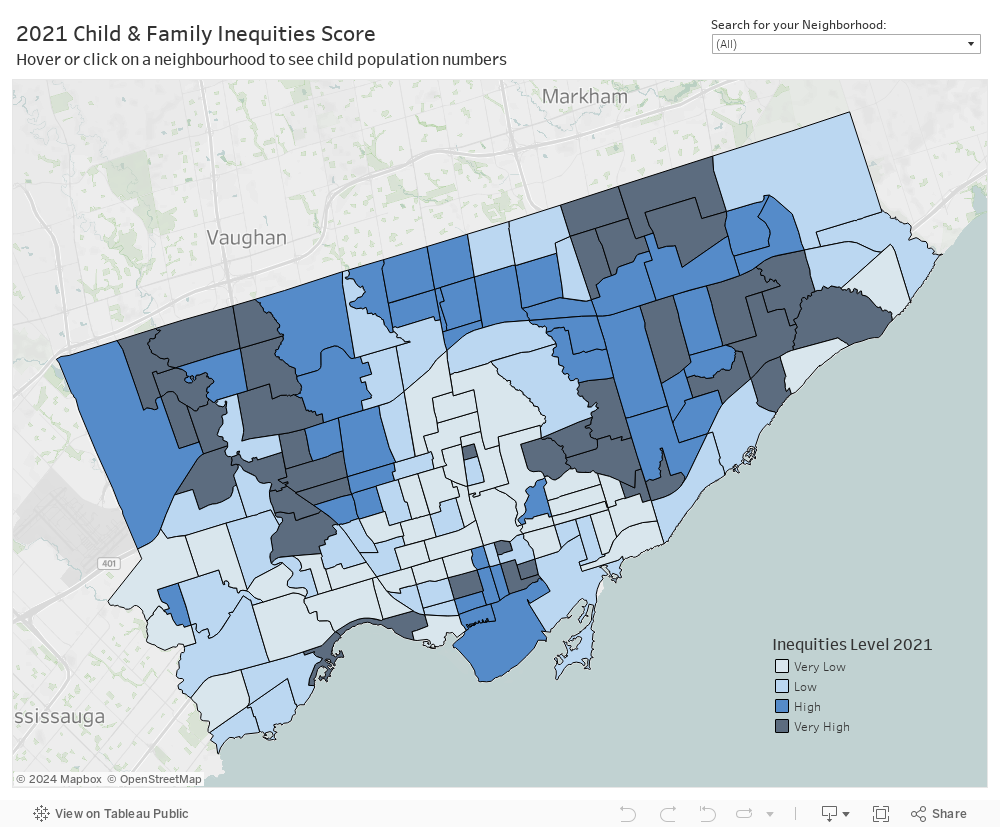
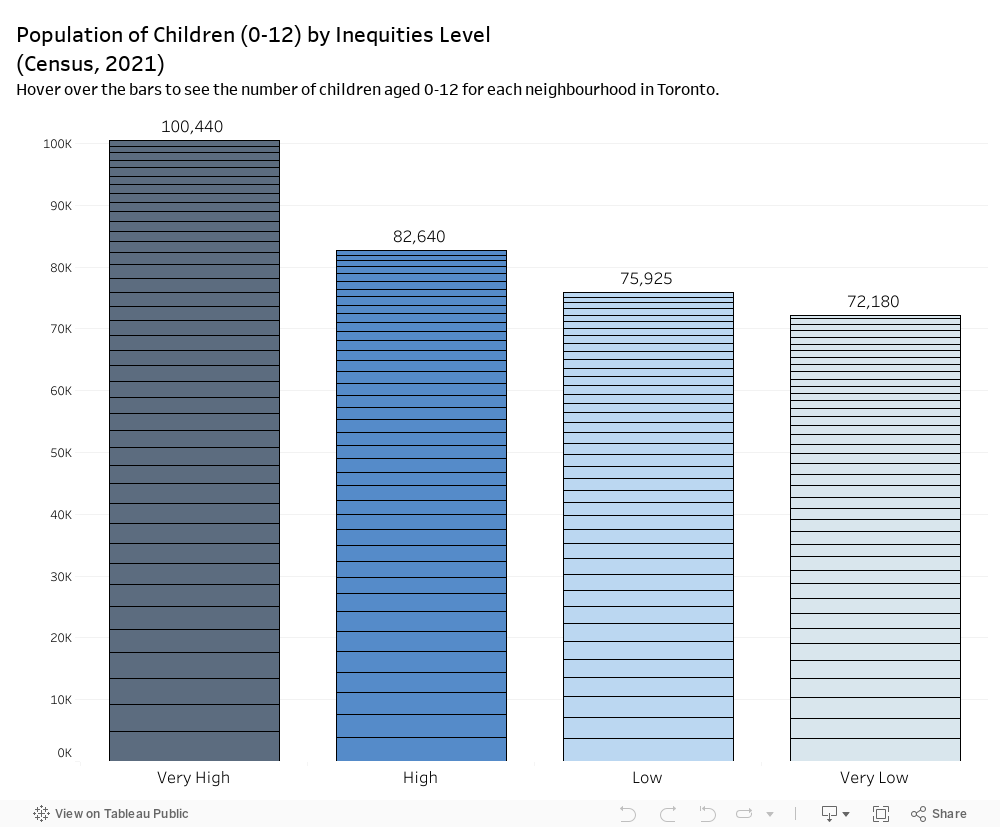
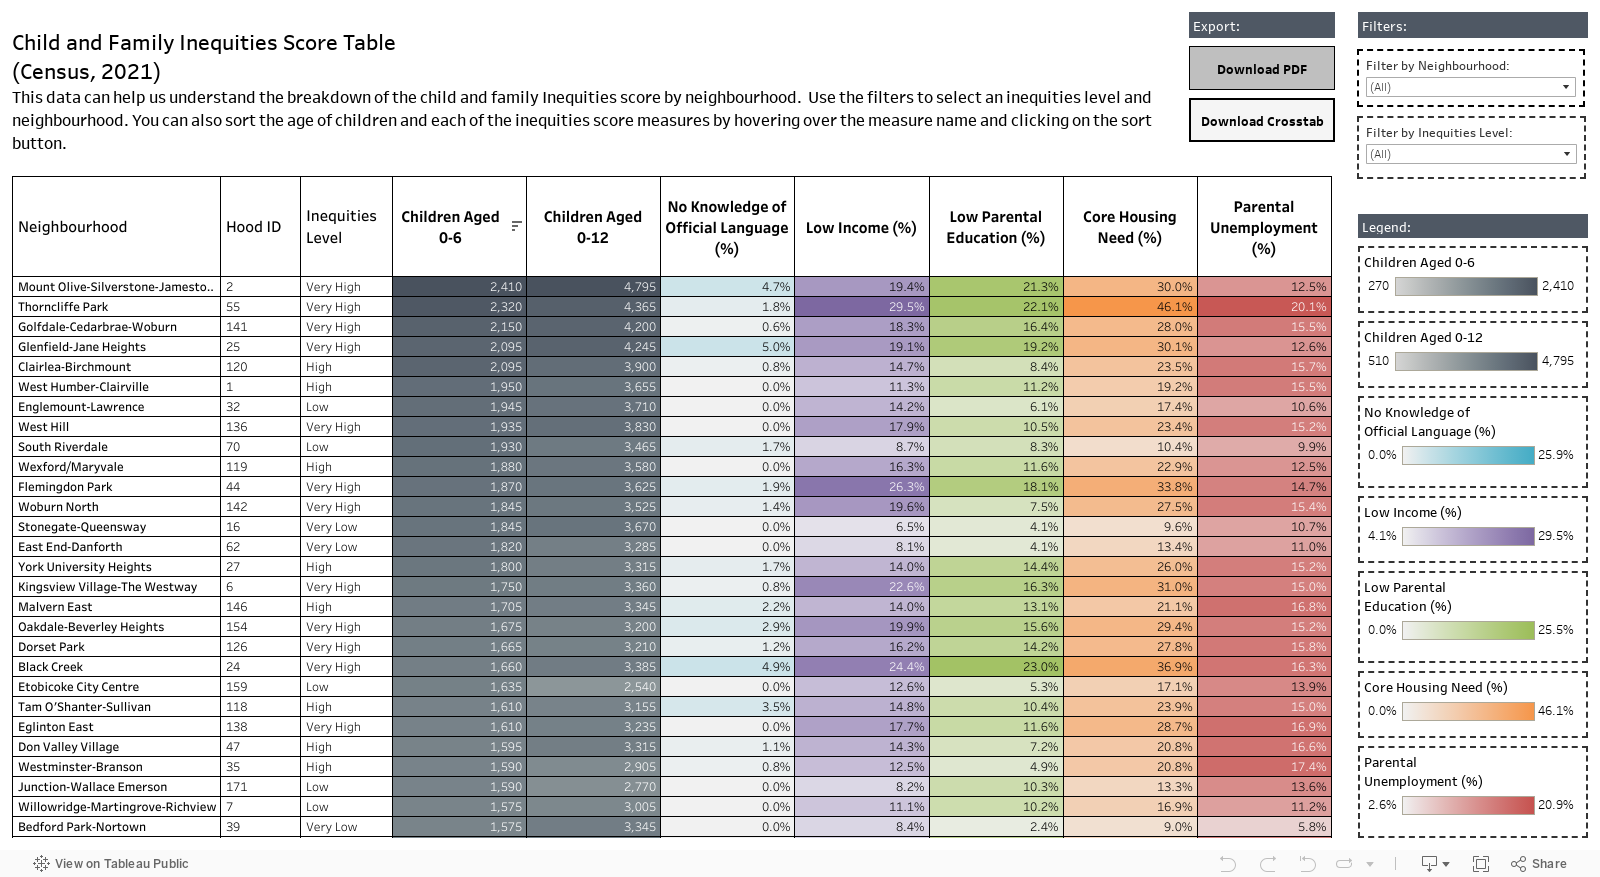
Income is one of 5 indicators that make up the Child & Family Inequities Score. To determine each neighbourhood’s inequities level each indicator is z-standardized, weighted, summed and sorted by score and split into 4 equal groups. The 40 highest scoring neighbourhoods being “Very high inequities” and the 40 lowest scoring neighbourhoods being “Very low inequities”. This recent update saw 78% of neighbourhoods remaining in the same inequities level, as compared to 2016. All neighbourhoods that changed inequities level moved up or down by only one level. Due to the comparative nature of this composite score, neighbourhoods are compared against each other, which means the overall decrease in low-income prevalence is experienced relatively.
Sources:
[1] 2021 Census Backgrounder Families Household Marital Status Income (toronto.ca)
[2] A census family consist of couple families with or without children and lone-parent families. A household takes into consideration the living arrangements and not the relationships between household members.
[3] Low Income Measure: Comparison of Two Data Sources, T1 Family File and 2016 Census of Population (statcan.gc.ca)
[4] https://www.fraserinstitute.org/sites/default/files/does-the-canada-child-benefit-actually-reduce-child-poverty.pdf