Early Development Instrument – EDI
The EDI is a population-based measure for communities that is used across Canada and internationally. The Offord Centre for Child Studies at McMaster University developed the EDI questionnaire which is completed by kindergarten teachers and measures a child’s ability to meet age-appropriate developmental expectations in five general domains. Each domain is an indicator of child outcomes.
- Physical Health and Well-Being – Children are healthy, independent and rested each day.
- Social Competence – Children play and get along with others, share, and show self-confidence.
- Emotional Maturity – Children can concentrate on tasks, help others, show patience and are not often aggressive or angry.
- Language and Cognitive Development– Children are interested in reading and writing, can count, and recognize numbers and shapes.
- Communication Skills and General Knowledge – Children can tell a story and communicate with adults and other children.
Learn more about the EDI domains here.
EDI results for Toronto
For the 2017/2018 EDI cycle, there were 25,020 senior kindergarten children from the four publicly funded school boards (TDSB, TCDSB, Conseil Scolaire Viamonde, Conseil Scolaire MonAvenir) who participated. This represents approximately 93% of senior kindergarten-aged children living in the Toronto. It is assumed that the remaining 7% of children attend private school or, are not yet enrolled in school. The final valid number of questionnaires used for analysis includes 22,853 children without special needs. A separate Special Needs Report* includes 1,172 children.
The Offord Centre compiled EDI results for all Ontario municipalities and provided Toronto with two customized reports:
- Summary Report, Senior Kindergarten Students, School year 2017/2018 (includes a *Special Needs Report on page 13)
- 5 Cycles of the EDI in Ontario
If you need an alternate version of these reports contact raisingthevillage@toronto.ca
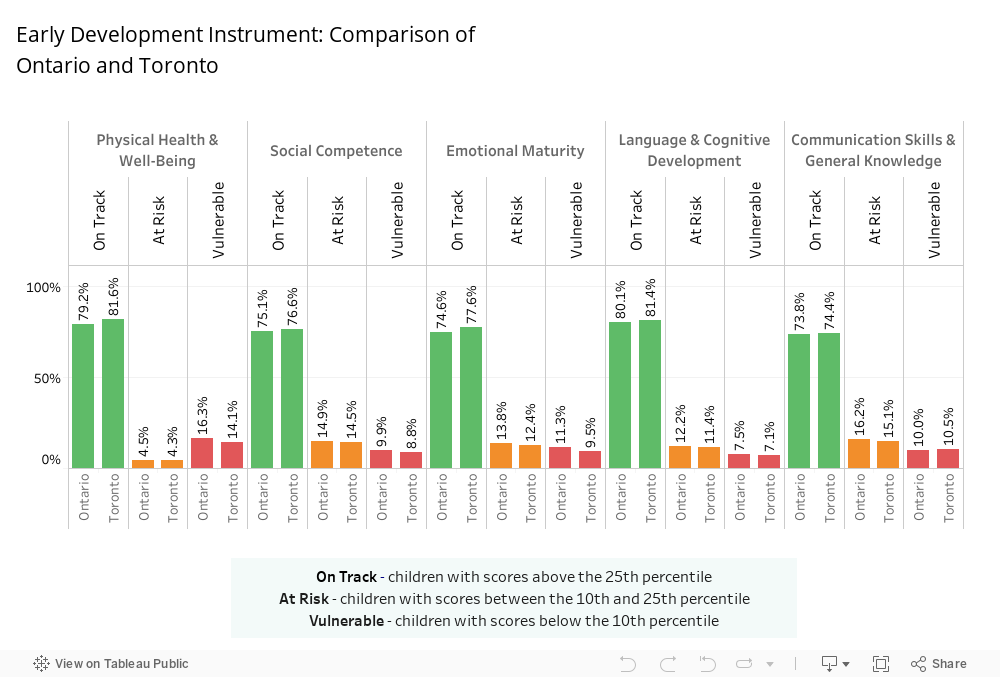
A comparison of Toronto versus Ontario shows Toronto children are doing slightly better than the Ontario average in all domains.
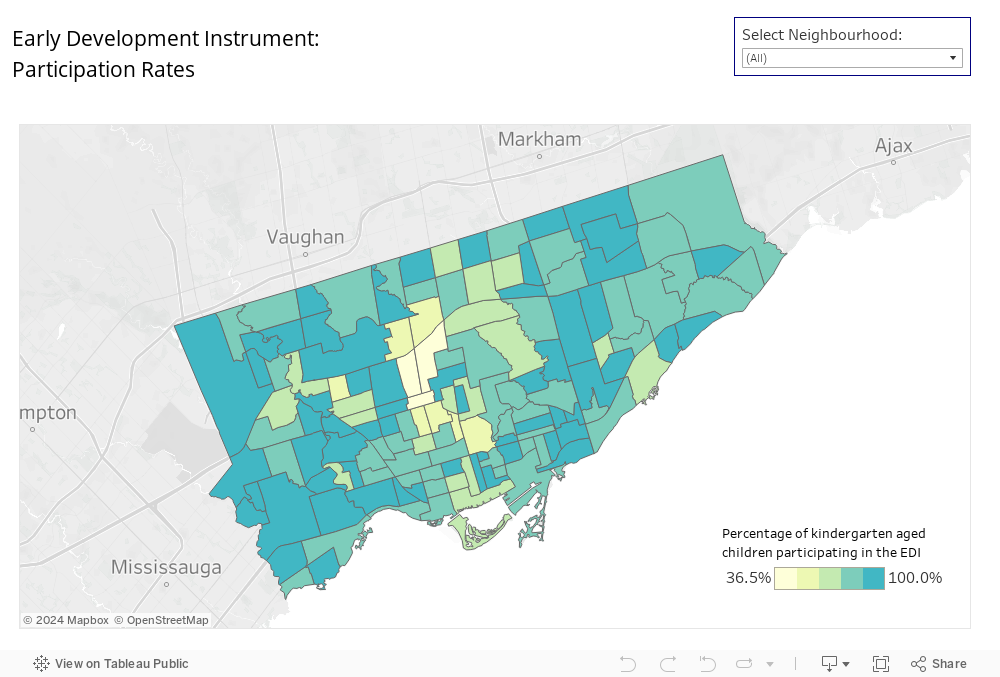
EDI participation by neighbourhood
For Raising the Village, we are reporting EDI results at a neighbourhood level. While the City participation rate is approximately 93% of all senior kindergarten aged children, neighbourhood participation ranged from 39% to 100% as indicated in the map below. The results from neighbourhoods with lower participation should be used with caution.
Neighbourhood Comparison
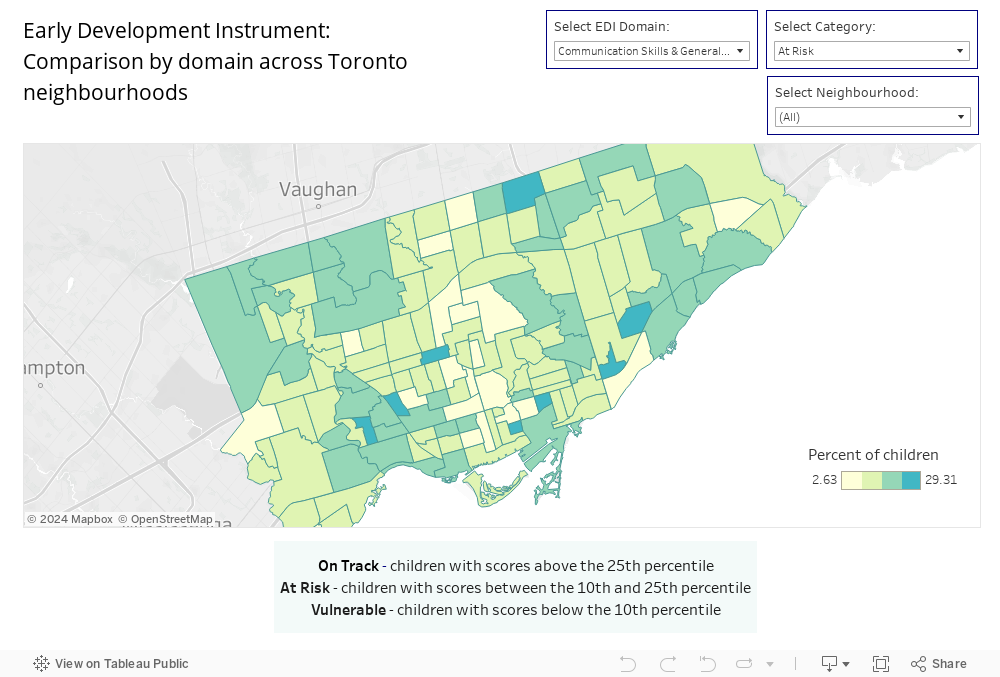
Comparing EDI results at a neighbourhood level helps to identify areas of Toronto that need our attention. The tables and maps below have filters that allow you to explore different neighbourhoods and compare EDI results across domains.
Explore the map and compare by domain across neighbourhoods
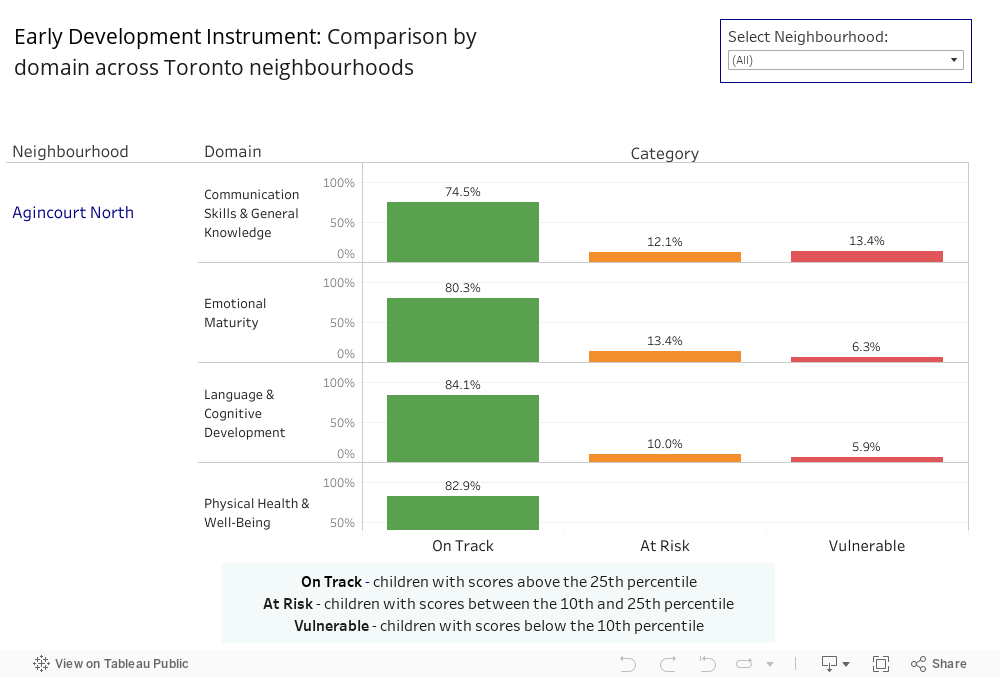
Explore the chart and compare by domain across neighbourhoods
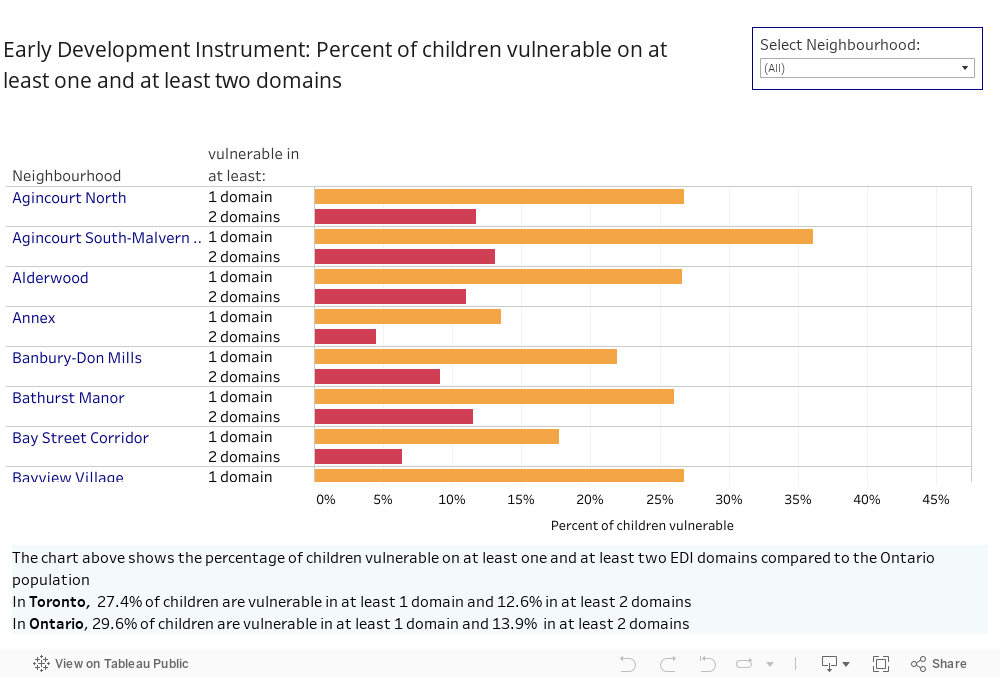
Explore the chart and compare vulnerable children across neighbourhoods
While EDI is a reliable and validated measurement tool, there is a risk of relying on only one source to reach conclusions about the well-being of children. Explore over 100+ indicators on the Raising the Village neighbourhood dashboard to help better understand child well-being in Toronto.