Contrast
Font Size

Indicators

Explore 100+ indicator dashboards below. There are multiple tabs at the top of each dashboard that will bring you to different views. Use the filters within the dashboards to drill-down and ask specific questions of the data.

Watch this short video to learn more about how to use the Indicator Dashboards.

Physical Health & Development

Physical Health & Development

Children are born healthy, and reach their optimal physical health and development.

Defining health

The World Health Organization (WHO) defines health as “a state of complete physical, mental and social well-being and not merely the absence of disease or infirmity”. The Ottawa Charter for Health Promotion states that, in order to be healthy, “an individual or group must be able to identify and to realize aspirations, to satisfy needs, and to change or cope with the environment”. In this way, health is seen as a resource or an asset that helps us lead our everyday lives.

Healthy births

A healthy birth for every child in Toronto is an important goal because a healthy birth is a significant predictor of future health, development and overall well-being. A healthy birth is closely linked to the health of the mother (starting from before conception), which is affected by many social and material factors.

Physical health and development

Physical health and development, mental health, and social and emotional development are all intrinsically linked. The exercise of breaking well-being into separate outcomes poses inherent challenges because all aspects of well-being are so connected. Separating the Physical Health & Development Outcome from the Mental Health & Social Development Outcome ensures that each outcome can be measured in a manageable and appropriate way.

Screen time

What is it?

Screen time is based on TDSB students (grades 4 to 8) who reported how much time they spent watching TV or videos or playing computer/video games on a school day. “Less than 2 hours per day” includes students who responded “none”, “less that 1 hour per day”, and “1-2 hours per day” and “More than 2 hours per day” includes “2-3 hours per day” and “More than 3 hours per day”.

Limitations

This indicator is not able to identify beneficial screen time such as a computer game that helps students advance math skills or an educational video that may be assigned for homework.

Active transportation to school

What is it?

Active transportation to school is based on the precentage of TDSB students (grades 4 to 8) who reported walking or biking to school.

Limitations:

This indicator asks children to identify how they get to and from school from a selection of transportation modes. There are some active transportation modes that may not be represented in the results such as using a scooter or a skateboard to get to or from school.

Physical Exercise

What is it?

Physical exercise is based on the percentage of TDSB students (grades 4 to 8) who reported how often in a regular school week they exercised or took part in a sport that caused them to sweat or breath harder.

Limitations

This indicator only accounts for physical activities that cause sweat or heavy breathing (aerobic activity), leaving out other forms of excercise (e.g. resistance training, flexibility training) that are equally beneficial to well-being. Furthermore, it only accounts for frequency, and not intensity of physical activity.

Hours of sleep

What is it?

Hours of sleep is based on the percentage of TDSB students (grades 7 to 8) who reported average hours of sleep on a school night. “Less than 8 hours” includes students who responded “Less than 5 hours”, “5 hours”, “6 hours” or “7 hours” responses and “8 or more hours” includes “8 hours”, “9 hours” or “More than 9 hours”.

Limitations

This indicator does not take into account sleep quality. Frequently interrupted sleep could impact overall health. There are also various guidelines and studies that show that grade 7 and 8 may have different recommended hours of sleep. Canadian 24-hour movement guidelines recommends that for grade 7 students (predominantly 13 year olds) the minimum recommended hours of sleep is 9 hours and for grade 8 students (predominantly 14 year olds), the minimum recommended hours of sleep is 8 hours. Centers for Disease Control and prevention (CDC) recommends minimum of 8 hours of sleep per day for 13-18 years.

Tiredness

What is it?

Tiredness is based on the percentage of parents of TDSB students (JK to grade 6) who reported how often their child seemed tired in the morning.

Limitations

This indicator does not account for whether a parent is actually present to see their child wake up in the morning. It also does not elaborate on the multitude of reasons why a child may experience tiredness in the morning including: circadian rhythm, morning/evening extracurricular activities, anxiety preventing sleep, problems at home preventing sleep, differences in school start times, etc.

Unhealthy Eating

What is it?

Unhealthy eating is based on the percentage of TDSB students (grades 4 to 8) who reported how often during a regular school week they ate fast food or soft drinks. “Often” includes “Every day” or “Most days” responses and “Sometimes” includes students who responded “1-2 days”.

Limitations

This indicator does not include the full range of unhealthy eating choices that students could make. For some students, unhealthy food choices may be due to socioeconomic constraints or the unavailability of healthier eating options close to where they live.

Healthy Eating

What is it?

Healthy eating is based on the percentage of TDSB students (Grades 4-8) who reported how often during a regular school week they ate vegetables, fruits, or dairy products/alternatives. “Often” includes “Every day” or “Most days” responses and “Sometimes” includes students who responded “1-2 days”.

Limitations:

This indicator does not include the full range of healthy eating choices that students could make (i.e. there may be healthy food or drink items not captured in the question.) Students may not remember the frequency that they ate healthy foods or may not know that a healthy food product was part of something they had consumed (i.e. within a smoothie). Students may have different access to healthy foods due to income, food insecurity, where they live and more.

Physical health check-up

What is it?

Physical health check-up is based on TDSB students (grades 7 to 8) who reported how often do they usually go to a doctor for a physical health check-up.”Yearly” includes students who responded “Once a year or more” and “Once every few years or Once” includes “Once every few years” or “Once”.

Limitations:

This indicator is based on the student’s memory of visiting their doctor. It may be difficult to accurately remember when and how many times they visited.

Dental check-up

What is it?

Dental check-up is based on TDSB students (grades 4 to 8) who reported how often do they usually go to a dentist to have their teeth checked. “Yearly” includes students who responded “Once a year or more” and “Once every few years or Once” includes “Once every few years” or “Once”.

Limitations:

This indicator is based on the student’s memory of visiting their dentist. It may be difficult to accurately remember when and how many times they visited.

Hearing test

What is it?

Hearing test is based on TDSB students (grades 4 to 8) who reported how often do they usually go to a doctor for an hearing test. “Yearly” includes students who responded “Once a year or more” and “Once every few years or Once” includes “Once every few years” or “Once”.

Limitations:

This indicator is based on the student’s memory of visiting their doctor. It may be difficult to accurately remember when and how many times they visited. Hearing tests may only be done once a problem with hearing is identified.

Eyesight Test

What is it?

Eyesight test is based on TDSB students (grades 4 to 8) who reported how often they usually go to a doctor for an eye test. “Yearly” includes students who responded “Once a year or more” and “Once every few years or Once” includes “Once every few years” or “Once”.

Limitations:

This Indicator is based on the student’s memory of visiting an eye doctor. It may be difficult to accurately remember when and how many times they visited. There may also be cases where the student did not realize they were receiving an eyesight test.

18-month Well Baby Visit

What is it?

The 18-month well baby visits is the percentage of one-year old children who completed an 18-month well baby visit check-up and are registered for health care. The indicator is calculated using physician billing claims data from the Ontario Health Insurance Plan (OHIP).

Limitations:

This indicator is only able to capture visits that are recorded using the appropriate physician billing code. Increase in rates over time could reflect an increase in the uptake of billing code, rather than the visit itself. Moreover, the 18-month well baby visit is not the only avenue to assess developmental progress and needs.

Immunization compliance

What is it?

Immunization Compliance is based on the percentage of students who were compliant with Ontario’s Routine Immunization Schedule. Under the Immunization of School Pupils Act, Toronto Public Health is responsible for the collection and assessment of student immunization records.

Limitations:

Given restriction in how data is captured, further analysis by income or other socio-demographic characteristics is not currently available.

Self-rated physical health

What is it?

Self-rated physical health is based on the percentage of TDSB students (Grades 7 to 8) who rated their physical health as either “Good,” “Very Good,” or “Excellent” and those who rated their physical health as “Poor,” “Fair,” or “Average.”

Limitations:

This indicator is highly subjective and relies heavily on students’ understandings and/or perceptions of physical health. Understandings of physical health are impacted by a variety of factors including culture, education etc. and thus, may vary drastically from person to person.

Physical health & well-being

What is it?

Physical health and well-being is based on the percentage of kindergarten children who scored on-track, at-risk and vulnerable based on 13 questions in areas of physical development (i.e. gross and fine motor skills, energy levels, independence in looking after own needs, and daily living skills.) The vulnerability cut-off for this domain is 7.3 out of 10 and the at-risk cut-off for this domain is 8.1 out of 10.

Limitations:

Children’s physical development can occur at different times. Children who are younger are more likely to score lower in this domain. The range of results in the EDI physical development domain has tended to be quite small, which means the scores of vulnerable children on this domain are not necessarily much lower than non-vulnerable children.

Breastfeeding

What is it?

Breastfeeding is measured by two indicators. Intention to breastfeed measures the percentage of women who indicated (during their pregnancy or at the time of birth) that they intended to breastfeed their infant(s). Infant feeding measures the percentage of infants who were being breastfed exclusively (breast milk only) or non-exclusively (e.g. combination of breast milk and substitute). Infant feeding was measured at different points in time such as at the hospital after giving birth or two to six months after birth.

Limitations:

The breastfeeding indicator should be interpreted with caution due to high missing responses for this indicator. Information about breastfeeding at other time points, such as at 6-months, is currently not available. Intention to breastfeed data from BORN and infant feeding data from the 2017 IFSP is self-reported, and thus may be subject to social desirability bias. It is likely that breastfeeding decreases after mothers leave the hospital.

Low Birth Weight

What is it?

Low birth weight is defined as a birth weight of less than 2,500 grams (5.5 pounds), regardless of gestational age. Low birth weight refers to the number of babies born low birth weight, expressed as a percentage of all live births.

Limitations:

This indicator does not consider gestational age (weeks of the pregnancy) or ethnicity, which are known confounders of low birth weight. Birth weight is only one dimension of a healthy birth and pregnancy.

Smoking During Pregnancy

What is it?

Smoking during pregnancy is based on the percentage of mothers who reported smoking at any time during pregnancy. Any smoking refers to smoking any amount of cigarettes during pregnancy, including those who did not know how many cigarettes were smoked.

Limitations

Smoking during pregnancy may be underreported, in part due to diminished social acceptance of this behaviour. As such, these rates could underestimate the true rate.

Mental Health & Social Development

Mental Health & Social Development

Children have the social, emotional, mental and spiritual well-being to reach their potential.

The positive aspects of mental health

Mental health is not merely the absence of mental illness: it also includes the positive aspects of mental health, which are inherently tied to other aspects of well-being, particularly social and emotional development. The Canadian Mental Health Association suggests that the following factors are key characteristics of positive mental health: the ability to enjoy life, to be resilient and bounce back from hard times, balance, self-actualization, and the ability to be flexible and adapt to change.

Childhood as an important life stage in itself

Many approaches to child well-being take a developmental approach that focuses on children as future adults. However, conceptions of child well-being should consider childhood as an important life stage in itself and not merely a stage towards adulthood. As such, measuring child well-being requires hearing from children themselves about their own experiences.

Spiritual well-being

While not the case for everyone, many people place personal value on spiritual well-being as an important aspect of overall well-being. Approximately 79% of residents in the Greater Toronto Area identified with some sort of religious association or spiritual tradition. In our consultations, we heard from the Aboriginal community that this was an important aspect of well-being for their community. In this outcome, spiritual well-being is meant to remain broad, and is not limited to religion.

Ability to express feelings

What is it?

Ability to express feelings is based on the percentage of TDSB students (grades 7 to 8) who reported being “Excellent or Good”, “Average”, or “Weak” at being able to express their feelings.

Limitations:

Being able to express feelings can depend on a number of intrinsic and extrinsic factors. For some, it may be ‘normal’ to express their feelings and deviation from this could be concerning, for others keeping their feelings inside and expressing them infrequently might seem ‘normal.’

Self-regulation

What is it?

Self-regulation is based on TDSB parent’s perception of how easy it is for their child (in grades K to 6) to a) make new friends, b) cope with difficulties, and c) control behaviour when angry or upset.

Limitations:

This indicator may depend on the the parent-child relationship. Some parents may have a highly developed understanding of how well their child makes friends and cope with challenges, others may have less contact with their children and less of an understanding of their daily experiences. As well, some children may share these experiences with parents and others may not.

Happiness

What is it?

Happiness is based on how often over the school year TDSB students (grades 4 to 8) reported feeling happy.

Limitations:

Feelings of happiness and sadness vary on a regular basis, although this question refers to the course of a year, the response may reflect a moment in time self-assessment of happiness. As well, happiness is only one aspect of well-being, this should be taken in the context of other aspects of well-being such as life satisfaction and feelings of self-worth. Additionally, there are multiple dimensions of happiness and this response may encompass happiness as it relates to life as whole, the school they go to, their friendships, relationships, home life, and other aspects.

Emotional Maturity

What is it?

Emotional maturity is based on the percent of kindergarten children who scored on-track, at-risk and vulnerable based on 30 questions in areas of emotional development (i.e., the ability to think before acting, an ability to deal with feelings, and empathetic response to other people). The vulnerability cut-off for this domain is 6 out of 10 and the at-risk cut-off is 7.3 out of 10.

Limitations:

Children’s emotional maturity can develop at different rates. Emotional skills can be highly dependent on factors that alter daily such as levels of sleep and mood.

Ability to enjoy daily activities

What is it?

Ability to enjoy daily activities is based on how often TDSB students (grades 7 to 8) have been able to enjoy their normal day to day activities over the past school year.

Limitations:

This indicator does not reveal the variety of reasons why a student may or may not be able to enjoy their daily activities. Some reasons may relate to their mental health, but others may be informed by their physical health, injuries, living with disabilities, and other complex experiences.

Feeling nervous or worried

What is it?

Feeling nervous or worried is based on TDSB student (grades 4 to 8) responses to how often they have felt nervous or worried over the past school year.

Limitations:

This indicator may be related to worrying about mental health (see other indicator) or could be influenced by a child’s daily stresses and concerns, feelings about the future (see other indicator), or their awareness of local and global issues.

Body image

What is it?

Body image is based on TDSB student (grades 4 to 8) responses to how often they have liked the way they look over the past school year.

Limitations:

How someone sees themself and feels about their body (body image) is related to self-confidence and self-worth. Although many people would like to change something about their appearance, body image issues are persistant worries that interfere with other thoughts and activities. Many factors influence how we regard our body: family life, television and movies, social media, advertising and fashion trends are some of them. These factors can be especially impactful when a young person’s body is rapidly developing and changing.

Worrying about mental health

What is it?

Worrying about mental health is based on how often TDSB students (grades 7 to 8) reported worrying about mental health and emotional well-being.

Limitations:

The degree to which a child has awareness of and concerns about their mental health could be connected to experiences with mental health among their family, friends, and their home life. This indicator may also speak to a child’s level of mental health literacy and this can vary based on school initiatives and media consumption.

Confidence

What is it?

Confidence is based on TDSB student (grades 4 to 8) responses to how often over the last school year they felt they were losing confidence in themselves.

Limitations:

The degree to which a child feels confident can vary day to day and can be drastically impacted by events that occurred around the time of responding to this question. This indicator does not indicate why the student may be losing confidence in themselves which could be due to a number of experiences such as difficulty in classes, issues with friends, and many more.

Learning & Education

Learning & Education

Children are engaged and curious learners, gain knowledge and skills, and have educational success.

Early learning and the transition to school

All children are born ready to learn, meaning their brains are programmed to develop new skills. The foundations set in the early years, even before children enter school, lay the course for later education and learning outcomes. Furthermore, children enter school having had different early experiences and care arrangements. The school system must be ready to meet the different needs and circumstances of all children.

Educational success

Research supports the correlation between education and well-being. However, each child and family defines educational success differently, based on their values. These differences should be taken into account when measuring educational success. Education gives children the tools and skills to meet their own goals. Furthermore, the degree to which children can reach those educational goals is often affected by other social and economic conditions.

Attitudes toward learning

One important aspect of education is the content learned: another is the attitude that a person has towards learning, which is often more difficult to define and measure. While attitudes toward learning may or may not correlate directly to educational success, they tend to differ based on socio-economic status. Ideally, children are engaged and curious learners because they enjoy learning, and it is relevant to their values and goals.

Worrying about school marks

What is it?

Worrying about school marks is based on TDSB students (grades 7 to 8) who reported how often during a regular school week they worried about the marks they received in school.

Limitations:

This indicator does not provide an explanation for why students may feel more or less worried about their school marks. Perceptions of what constitutes an ‘adequate’ or ‘good’ mark may vary considerably from student to student. Moreover, individual students may be more or less prone to feelings of worry or anxiety regardless of external factors.

Enjoying reading, writing and math

What is it?

Enjoying reading, writing and math is based on the EQAO student questionnaire that asks grade 3 and 6 students to report their level of enjoyment of reading, writing and math.

Limitations:

When answering this question, students may interpret reading, writing and math in the academic sense. Where a student may not express enjoyment conducting these actions in academic settings they may enjoy reading vast amounts of online material or spending hours inputting mathematical functions into gaming programs or writing on their web blog account.

Enjoying school

What is it?

Enjoying school is based on TDSB students (grades 4 to 8) who reported how often they enjoyed being in school.

Limitations:

This indicator does not illuminate or differentiate between factors that impact students’ enjoyment of school. For example, some students my not enjoy school because they struggle academically, while others may not feel sufficiently challenged. This indicator does not provide the ‘why’ behind responses.

Communication and general knowledge

What is it?

Communication and general knowledge is based on the percentage of kindergarten children who scored on-track, at-risk and vulnerable based on 8 questions  in areas of development that include the ability to communicate needs and wants, symbolic use of language, and age-appropriate knowledge about the surrounding world. The vulnerability cut-off for this domain is 4.4 out of 10 and the at-risk cut-off for this domain is 5.6 out of 10.

Limitations:

Children who are French or English Language Learners may be at a disadvantage in this domain, but may catch up in later childhood once they gain better mastery over English or French.

Language and cognitive development

What is it?

Language and cognitive development is based on the percentage of kindergarten children who scored on-track, at-risk and vulnerable based on 26 questions in areas of cognitive development that include reading, writing and numeracy, similarities and differences, and reciting information from memory. The vulnerability cut-off is 6.2 out of 10 and the at-risk cut-off is 8.1 out of 10.

Limitations:

Children who are French or English Language Learners may be at a disadvantage in this domain, but may catch up in later childhood once they gain a better mastery of English or French.

Academic concerns

What is it?

Academic concerns is based on parents of TDSB students (grades K to 6) who reported how often they had academic related concerns about their child.

Limitations:

This indicator does not account for the different expectations parents have for their childs’ academic achievements. What may cause concern amongst some parents, may be seen as normal by others. Moreover, parents may be more or less involved in their child’s academic life leading to different levels of awareness.

Prepared for secondary school

What is it?

Prepared for secondary school is based on the percentage of TDSB students (grades 7 to 8) who felt prepared for secondary school.

Limitations:

This indicator does not illuminate or differentiate between factors that may cause a student to feel more or less prepared for secondary school. Factors that may impact feelings of preparedness include, but are not limited to academic, mental, emotional, and social preparedness.

Self-rated skills

What is it?

Self-rated skills is based on TDSB students (grades 7 to 8) who rated themselves in computer use, athletic skills, social skills, problem solving, critical thinking, creativity and hands-on skills.

Limitations:

This indicator includes a number of skills that are not often traditionally assessed and may be hard to identify clearly such as problem solving, critical thinking and social skills. A student’s level of self-confidence will also impact the level at which they report their skills at.

Achievement in school assessment

What is it?

Achievement in student assessment is based on the percentage of grade 3 and 6 students who scored below the EQAO provincial standard test in reading, writing and math.

Limitations:

This indicator is not a complete reflection of all grade 3 and 6 students across the City of Toronto as private schools are not required to administer EQAO standardized testing to their students with the exception of the grade 10 Literacy test which is not showcased here.

Belonging to school

What is it?

Belonging to school is based on TDSB students (grades 7 to 8) who reported how often they felt a sense of belonging regarding their school.

Limitations:

This indicator does not account for the variety of factors that may lead a student to feel a sense of belonging to school. Sense of belongling may be influenced by ability to cultivate meaningful connections, academic success, school environment etc.

Comfortable reporting bullying

What is it?

Comfortable reporting bullying is based on TDSB students (grades 7 to 8) who reported how often they felt comfortable reporting bullying to teachers or other school adults if they or others were bullied.

Limitations:

This indicator does not account for inconsistant definitions/understandings of bullying. Children, in particuler, may not fully understand the range and complexity of behaviours that could be characterized as bullying. Moreover, students in grade 7 or 8, take classes in rotation with different teachers, so levels of comfortableness reporting bullying may vary from teacher to teacher.

Feeling safe at school

What is it?

Feeling Safe at School is based on how often TDSB students (grades 4 to 8) feel safe in the classroom, outside on school property, and in other parts of the school.

Limitations:

Each respondent may define safety differently. This indicator does not provide information about why children feel unsafe. Perceptions of safety may not correlate to other measures such as bullying or violence at school.

Help with homework

What is it?

Help with homework is based on TDSB students (grades 7 to 8) who reported how often they needed help with homework. For those students who did need help with homework, they reported who usually helps them: parent/caregivers, other family members, friends, teachers, paid tutors, free tutors, and no one.

Limitations:

Some students may not accurately describe the degree of homework help they may need due to feelings of shame or inadequacy. There was no option for students to indicate other supports they seek when needing help with homework such as a local librarian or youth leader.

Adequate learning support at school

What is it?

Adequate learning support at school is based on TDSB students (grades 7 to 8) who reported how often they felt they received adequate support to do well in school.

Limitations:

This indicator does not account for the different needs students have in terms of learning support at school. For example, students with extra support needs may have different experiences receiving support than others. Moreover, this indicator relies heavily on student expectations of ‘adequate’ support which will also vary from student to student.

Discussing school issues with teachers

What is it?

Discussing school issues with teachers is based on TDSB students (grades 7 to 8) who reported how often they felt comfortable discussing school-related issues with teachers.

Limitations:

This indicator does not explain why students may feel more or less comfortable discussing school issues with teachers. It may be related to individual issues, the class climate/environment, or specific student/teacher relationships. For students in grade 7 or 8, taking classes in rotation with different teachers and subject areas, the level of comfort may vary but the student is required to answer in a global way. Finally, this indicator does not take into account other people/relationships students may feel comfortable discussing school related issues with.

Feeling cared about by teachers

What is it?

Feeling cared about by teachers is based on TDSB students (grades 4 to 8) who reported how often they felt that their teachers cared about them.

Limitations:

This indicator does not explain why students may feel more or less cared about by teachers. Feeling cared about by teachers may vary based on student expectations of the student/teacher relationship. Moreover, students in grade 7 or 8, take classes in rotation with different teachers, so student/teacher relationships may vary from teacher to teacher.

Rights & Opportunities

Rights & Opportunities

Children’s rights are fulfilled: they have opportunities for personal development and participate in decisions about their lives.

Children’s rights are fundamental

Canada is a signatory to the United Nations (UN) Convention on the Rights of the Child, a legally binding international treaty that recognizes children’s rights as fundamental. The City of Toronto also adopted a Children’s Charter, which reflects the provisions of the UN Convention in a local context. Children’s rights apply not only to basic needs, and protection from neglect and abuse, but also to developing their potential.

Opportunity requires access

Developing one’s potential requires opportunities to make it possible. However, it is not enough for opportunities to be available: they must also be accessible. Therefore, barriers that prevent access to opportunities such as cost, transit, language, and cultural appropriateness, must be considered when measuring opportunity.

Participation

Participation is a key component of the Convention on the Rights of the Child. On matters that directly impact their lives, children have the right to say what they think should happen and have their opinions taken into account. Furthermore, children have the right to participate in society, and have a say on matters affecting their social, cultural, religious, economic and political life.

Low-income children

What is it?

Children Living in Low-Income Households is based on the percent of children aged 0-12 living below the Low-Income Measure-After Tax (LIM-AT), which includes households with an after-tax income that is less than half the median income for all households, adjusted for family size. In 2016, the LIM-AT for a family of four was $44,266 .

Limitations

The Low-Income Measure is a relative measure of poverty, and does not capture conditions of absolute or material poverty that many families in Toronto experience. Further, income is only one aspect of a family’s financial conditions that impact children’s well-being, and does not account for debt, assets and savings.

Learning about human rights

What is it?

Learning about human rights is based on TDSB students (grade 7 to 8) who reported how often they are encouraged to think or learn about human rights/social justice issues that affect our world (e.g., gender identify, poverty, racism, global warming).

Limitations:

This indicator is based on the student’s subjective assessment of whether the school “encouraged” them and assumes the student understands the examples of “gender identity”, “poverty”, “racisim” and “global warming”. Students may have different thresholds for assessing “encouraged”. They may not be able to make connections between school-driven topics and the global terms. (e.g., they might not relate climate change to discussions of “global warming ” or LGBTQ to discussions to “gender identity”)

Hunger

What is it?

Hunger is based on TDSB students (grades 4 to 8) who reported how often (during a regular school week) they feel hungry because there is not enough food at home.

Limitations:

This indicator assumes that students have a “regular school week”. However, for some students, they may experience variability in their access to food (e.g. more food may be stocked at times of the month that the household receives money and less at other times). It may therefore be difficult for the student to define a regular school week. “Not having enough food at home” may be interpreted in different ways – socio-economic challenges, variation in assessment of “enough food” or patterns of food shopping and storage (e.g. if the shopping pattern is once a month, there may not be “enough food” at certain times just before the shopping).

Comfortable participating in class activities

What is it?

Comfortable participating in class activities is based on TDSB students (grades 4 to 8) who reported how often they feel comfortable participating in class activities and discussions.

Limitations:

This indicator does not tell why the student is comfortable or not speaking in class. It may be related to individual issues or related to the class climate/environment. For students in grade 7 or 8, taking classes in rotation with different teachers and subject areas, the level of comfort may vary but the student is required to answer in a global way.

Comfortable giving opinions in class

What is it?

Comfortable giving opinions in class is based on TDSB students (grades 4 to 8) who reported how often they feel comfortable speaking up in class to give their opinion.

Limitations:

This indicator does not tell why the student is comfortable or not speaking in class. It may be related to individual issues or to the class climate/environment. For students in grade 7 or 8, taking classes in rotation with different teachers and subject areas, the level of comfort may vary but the student is required to answer in a global way.

Support from parents in course selection

What is it?

Support from parents in course selection is based on TDSB students (grades 7 to 8) who reported how often their parents/caregivers support their interests/choices for school courses.

Limitations:

This indicator is based on the students’ assessment of how often parents/caregivers support their interests/choices for their school courses. However, presumably, course selection and interests are limited at this age level to once or twice a year or perhaps may not apply at all. The response scale, however, assumes a more ongoing frequency.

Involvement with life decisions

What is it?

Involvement in life decisions is based on TDSB students (grades 7 to 8) who reported how often their parents/caregivers involve them in decisions that affect their life.

Limitations:

This indicator does not define terms so there may be variation in the interpreation of the question across students.  For example, the type of involvement could be interpreted as just talking about it up to actually making a decision or having a vote in it.  Likewise, “decisions that affect your life’  may be interpreted as a general everyday decision such as what they would like for a meal  or as a significant decision about, for example, divorce conditions.   

Participation in out-of-school activities

What is it?

Participating in out-of-school activities is based on the percentage of parents of TDSB students (grades K to 6) who reported how often their child participates in arts, music, individial sports, team sports, or clubs outside of school.

Limitations:

This indicator does not include the full range of extra-curricular and learning activities that support development – children may participate in programs that are not captured in the question. This indicator also does not provide information about the quality of these programs, or if the child participates consistently throughout the year.

Participation in early learning & care

What is it?

Participating in early learning & care programs is based on the percentage of parents of TDSB students (grades K to 6) who reported how often their child regularly attended the following programs before entering kindergarten: child care centre, child-family programs, nursery/pre-school, home child care, or none.

Limitations:

This indicator is not inclusive of a variety of informal child care programs that a child may participate in. This indicator does not account for the amount of time the child spent in the program or the quality of the program.

Nurture & Care

Nurture & Care

Children have safe, nurturing and positive environments that encourage learning and development.

Healthy child development requires nurturing

Child well-being is strongly influenced by the many environments in which children grow, live, and learn, particularly by the nurturing qualities of those environments. Nurturing refers to caring for and encouraging one’s development.

Positive environments

Parents and caregivers are not solely responsible for providing nurturing environments for children because the home is not the only environment in which children grow up – school, child care, the neighbourhood, the broader community and other environments also influence child well-being. Even within the home environment, how well caregivers are supported by governments and civil society must be considered, as well as the resources that are available to them in order to provide nurturing environments for children.

Safety and protection

Despite an important focus on the positive aspects of child well-being like nurturing and development, there are still many children that face abuse, neglect, poor housing conditions, hunger, or that are taken into the child welfare system. Children in the welfare system are more likely to be diagnosed with a special need, and are less likely to graduate from high school. Policies directed towards protection and basic needs can take many forms, for example: quality standards of care, family support, as well as addressing poverty and inequality.

Discussing school activities with a parent

What is it?

Discussing school activies with a parent is based on the EQAO student questionnaire that asks grade 3 and 6 students how frequently they spoke with a parent, guardian or other adult that they live with about their school activities.

Limitations:

Students responding to this question may be referring to their interaction with an adult that they are living with and not their parent which does not explain the story the indicator is trying to describe.

Discussing personal issues with a parent

What is it?

Discussing personal issues with a parent is based on TDSB students (grades 7 to 8) who reported how comfortable they feel discussing personal issues with their parent.

Limitations:

This indicator does not take into account other people the students may feel more comfortable discussing personal issues with. This could be a teacher, relative, friends etc. that they trust.

Parents take interest

What is it?

Parents take interest is based on TDSB students (grades 7to 8) who reported how often their parents show interest in what they have to say.

Limitations:

The indicator does not take into account two-way interactions between parents and the students. It does not include parents’ encouragement to have conversations and the students feeling of their opinions being valued.

Parents give praise

What is it?

Parents give praise is based on TDSB students (grades 7 to 8) who reported how often their parents praise/compliment them when they do something well.

Limitations:

This indicator does not take into account praising for effort and encouragement. It only speaks to praise for doing something well.

Reading with a parent at home

What is it?

Reading with a parent at home is based on the EQAO student questionnaire that asks grade 3 and 6 students how often they read with a parent/caregiver at home.

Limitations:

Students in grade 6 may have reported back on this question with an answer that they feel would be acceptable by their peers. Specifically, they may not have wanted to admit that they read to their parents as it may be an answer that portrays them as ‘childish.’ This social desirability bias may have a profound effect on the data reported for students in grade 6.

Discussing school issues with a parent

What is it?

Discussing school issues with a parent is based on TDSB students (grades 7 to 8) who reported how comfortable they feel discussing school issues with their parent.

Limitations:

This indicator does not take into account other people the students may feel more comfortable discussing school issues with. This could be a teacher, relative, friends etc. that they trust.

Difficulty finishing homework at home

What is it?

Difficulty finishing homework at home is based on TDSB students (grades 7 to 8) who reported how often they have difficulty finishing homework due to having no internet access at home, no computer access at home, no study materials to help them, or no proper space at home to do homework.

Limitations:

This indicator does not account for a number of other factors in a home learning environment that may make it more difficult for students to finish homework at home such as noise, discomfort in the home environment, having to care for siblings, and more.

Feeling safe to and from school

What is it?

Feeling safe to and from school is based on TDSB students (grades 4 to 8) who reported how often they feel safe on their way to school and on their way home from school.

Limitations:

Each respondent may define safety differently. This indicator does not provide more information about why children may feel unsafe. Perceptions of safety may not correlate to other measures such as crime rates. Children may have different ways of getting to and from school and this indicator does not account for that.

Feeling safe in the community

What is it?

Feeling safe in the community is based on TDSB students (grades 4 to 8) who reported how often they feel safe on their street or in their neighbourhood.

Limitations:

Each respondent may define safety differently. This indicator does not provide more information about why children may feel unsafe. Perceptions of safety may not correlate to other measures such as crime rates.

Family Health

Family Health

Families experience optimal individual physical and mental health, and contribute to the growth and development of each family member.

Health at the family level

The health of each family member impacts, and is impacted by, the health of other family members. For this reason, the outcome for family health has two inter-related goals – optimal health for each individual, and a healthy family dynamic that supports individual health. While these two goals are each important individually, our emphasis is on the relationship between them – how the family dynamic impacts the health of each family member and vice versa.

Optimal individual health

Much like the child outcomes, we emphasize each individual’s optimal health, and the resources and abilities they have at their disposal to achieve it. Unlike the child outcomes, however, this family outcome includes all aspects of health and development together – physical, emotional, social, mental and spiritual.

Healthy family dynamic

The relationship between family members is an important aspect of family health. In a positive sense, each family member can support one-another in making healthy choices and engaging in healthy behaviours. In a negative sense, a strained family dynamic can become a source of poor health. For example, increased fighting or negative communication can contribute to higher levels of stress and therefore impact the health of individual family members [1].

Caregiver heavy drinking

What is it?

Caregiver heavy drinking is the percentage of respondents who reported at least one occasion in the past 12 months when they drank 5 or more drinks for men or 4 or more drinks for women. This indicator is based on the Canadian Community Health Survey (CCHS) responses to the question: “How often in the past 12 months have you had [5 (male) / 4 (female)] or more drinks on one occasion?” . Heavy drinking was identified as those who drank 5/4 or more drinks

Limitations:

This indicator may be underreported due to heaving drinking being seen as a socially undesirable behaviour. Further, respondents may unclear about the amount that they drink and if that amount constitutes heavy drinking.

Students worrying about family members

What is it?

Students worrying about family members is based on TDSB students (grades 7 to 8) who reported how often they worry about their family members (e.g., relationships, health issues).

Limitations:

This indicator does not specify which family members students are worried about or the specific reason for their worry. It is also unclear whether the cause of worry is partly due to a student concurrently experiencing an anxiety disorder or other mental health conditions.

Caregiver depression

What is it?

This variable is derived from a set of questions in the self-reported depression module in the Canadian Community Health Survey (CCHS). The questions in this module are from a validated instrument to measure self-reported depression. The instrument is called PHQ-9 and was developed by Spitzer et al (1999). Questions in this module include “Over the last two weeks, how often have you: Had little interest or pleasure in doing things? Felt down, depressed, or hopeless? Had trouble falling or staying asleep, or sleeping too much? Felt tired or had little energy? Had poor appetite or overate? Felt bad about yourself, or that you are a failure or have let yourself or your family down? Had trouble concentrating on things, such as reading the newspaper or watching television? Been moving or speaking so slowly that other people could have noticed? Or the opposite, being so fidgety or restless that you have been moving around a lot more than usual?”. The derived responses included: no depression, minimum depression, mild depression, moderate depression, moderately severe depression, and severe depression which were regrouped to two categories for reporting: no depression and any depression.

Limitations:

Feelings of depression can vary on a regular bases, although this question refers to over the last two weeks, the response may reflect a specific moment in time. Due to this being a point-in-time question, there may be a number of false negatives or positives depending on the specific emotional state the respondent was in when filling out the CCHS.

Caregiver self-perceived mental health

What is it?

This variable is based on the question “In general, would you say your mental health is…?” in the Canadian Community Health Survey (CCHS). The responses included poor, fair, good, very good, and excellent which were regrouped to poor/fair/good and very good/excellent for reporting.

Limitations:

This indicator is based on self-perceived mental health and may be interpreted differently based on respondents view of mental health and likelihood to disclose. Perceptions of mental health can change over time and be dependent on circumstances or recent experiences.

Caregiver mental health barrier

What is it?

Caregiver mental health barrier is the percentage of families with at least one caregiver who experienced difficulties doing certain activities as a result of emotional, psychological, or mental health conditions (e.g., anxiety, depression, bipolar disorder, substance abuse, anorexia, etc.) that was expected to last for six months or more. Only families with children aged 0-12 are included in this indicator.

Limitations:

This indicator is self-reported through the census and may result in inconsistent or unreliable data. Firstly, the census is filled out by one member of the household and that individual may be answering on behalf of someone else which could result in an incorrect response for that individual. Secondly, these data have not been reviewed extensively by Statistics Canada and has thus received minimum edits and must be considered with caution. Thirdly, there may be cultural or other factors (e.g., stigma) that may result in underreporting of mental health conditions.

Caregiver self-perceived general health

What is it?

Caregiver self-perceived general health is based on the question “In general, would you say your health is…?” in the Canadian Community Health Survey (CCHS). The responses included poor, fair, good, very good, and excellent which were regrouped to poor/fair/good and very good/excellent for reporting.

Limitations:

This indicator is based on respondent’s self-perceived general health which can vary over time or be dependent on how the respondent is feeling that day. Respondent’s may have different thresholds for what they consider to be “good” health and that level may be very different from person to person.

Regular health care provider

What is it?

This variable is based on the question “Do you have a regular health care provider? By this, we mean one health professional that you regularly see or talk to when you need care or advice for your health?” in the Canadian Communiy Health Survey (CCHS).

Limitations:

The time trend data for this indicator was combined across two years to allow for this information to be reported.

Health insurance

What is it?

Health insurance is based on two questions from the 2015-2016 Canadian Community Health Survey (CCHS) about access to health insurance coverage. This indicator looks at responses to the questions: “Do you have insurance that covers all or part of your dental expenses?” and “Do you have insurance that covers all or part of your prescription medications?”.

Limitations:

This indicator includes those who are covered by both private and government insurance and does not distinguish between the two.

Unmet healthcare needs

What is it?

Unmet healthcare needs is based on the Canadian Community Health Survey (CCHS) question “During the past 12 months, was there ever a time when you felt that you needed health care but you didn’t receive it?”.

Limitations:

This indicator relies on respondent’s identifying and remembering that their healthcare needs were not met. Many people may have unmet healthcare needs but may not be aware they exist or be able to identify that their needs were not completely met. This time-trend data for this indicator was combined over two years to allow for this information to be reported.

Resilience & Support

Resilience & Support

Families are able to cope with challenges, and have consistent support through social networks and appropriate services.

Chronic stress and resilience

Major hardships or transitions in life can lead to chronic stress, which can have long-term impacts on well-being at both the physical and psychological level. Such challenges arise from situations that are often beyond one’s control, such as coping with conditions of low income, poor quality housing, food insecurity, inadequate working conditions, insecure employment, and various forms of discrimination.

Resilience refers to one’s ability to bounce back from hardships: to cope in a healthy way that minimizes negative impacts. While not all factors that contribute to family resilience are known, we do know that support is an important protective factor.

Families get support from different sources

Some families rely more on support from extended family or friends, and some families may reach out to community or public services for support. As income can provide a buffer against risk factors that can lead to chronic stress, often extra support resources must be targeted to low-income families and those at highest risk. Families must be able to rely on support mechanisms – inconsistent support could exacerbate the problem. Furthermore, the services that families rely on must be appropriate for their needs, as they should be culturally and age appropriate, and available at the time needed.

Caregiver levels of stress

What is it?

Caregiver levels of stress is based on the percentage of caregivers and non-caregivers who reported the amount of daily stress in their lives. This indicator is based on the Canadian Community Health Survey (CCHS) responses to the question: “Thinking about the amounts of stress in your life, would you say that most of your days are..?”. The responses included not at all stressful, not very stressful, a bit stressful, quite a bit stressful, and extremely stressful which were regrouped to quite a bit/extremely stressful and not at all/not very stressful for reporting.

Limitations:

As a result of the 2015 redesign, the Canadian Community Health Survey (CCHS) has a new data collection strategy, a new sampling design, and has undergone major content revisions. With all these factors taken together, caution should be taken when comparing data from previous cycles to data released for the 2015 cycle onwards. Caregiver level of stress information is self-reported. Self-reported data have a number of limitations. People may under-report or over-report certain behaviours or characteristics based on their perceived social desirability. Due to the small sample size of caregivers in the CCHS, most socio-demographic stratifiers could only be reported as binary variables to ensure reportability.

Student level of stress

What is it?

Student levels of stress is based on TDSB students (grades 4 to 8) who responded how often they felt under a lot of stress or pressure over the last school year.

Limitations:

Given that this question asks students to think about stress or pressure faced over the last school year, respondents may be primed to think more about school-related stressors rather than non-school related stressors. Furthermore, this indicator captures perceived levels of stress or pressure experienced by students, but the same situation may be stressful for one student but not for another.

Student ability to cope with difficulties

What is it?

Student ability to cope with difficulties is based on parents of TDSB students (grades K to 6) who reported how easy it is for their child to cope with difficulties. “Easy” includes parents who responded “Very easy” and “Easy”; “Not easy” includes parents who responded “Not easy” or “Not easy at all.”

Limitations:

The indicator does not describe or ask about the types of strategies students use to cope. Some coping strategies might be considered negative (e.g., distraction or trying to forget about the problem), whereas others are considered more positive (e.g., problem solving or seeking social support). Also, the effectiveness or appropriateness of a particular coping strategy may depend on the context or situation in which a child is in.

Students worrying about current events

What is it?

Students worrying about current events is based on TDSB students (grades 7 to 8) who reported how often they felt worried about current events (e.g., politics, racism, climate change).

Limitations:

A potential limitation of this question is the students’ subjective interpretation of the terms “current events” and “worry”.  Students may be broad or narrow in their interpretations of the events that invoke worry and/or how they judge the threshold for “worry”.

Students feeling hopeful about the future

What is it?

Students feeling hopeful about the future is based on TDSB students (grades 4 to 8) who responded how often they felt hopeful about the future over the last school year.

Limitations:

Given that this question asks students to think about the last school year, respondents may be primed to think more about hopefulness with respect to school-related outcomes. Also keep in mind that when interpreting this indicator that feeling hopeful for the future is one of several dimensions of resilience. It is also possible for resilient children to experience poor mental health (and for children with poor mental health to learn to be resilient).

Students who have moved schools

What is it?

Students who have moved schools is based on the EQAO student questionnaire that asks students how many schools they have attended before this one.

Limitations:

This indicator relies on the ability for students to remember the number of times they have changed schools. For some, moving schools may have happened when the student was quite young making it difficult to recall.

Families who recently moved

What is it?

Families who recently moved is based on the Statistics Canada 2016 Census mobility question that indicates whether the respondent lived in the same residence as they did 1 or 5 years ago. Families who moved in the last 1 or 5 years can be divided into non-migrants (people who remained in the same city when they moved) and migrants (people who moved to a different city). Migrants are classified as either internal migrants (if they moved from within Canada) or external migrants (if they moved from outside Canada).

Limitations:

This indicator relies on the respondent to accurately indicate how long ago they moved to their current place of residence. The question requires the respondent to think back to the exact day 1 and 5 years ago and to indicate where they were living at that time. There is a possibility that some respondents may not remember or have an exact day that they moved.

Families experiencing homelessness

What is it?

Families experiencing homelessness is based on the Shelter Management Information System (SMIS) average count and duration of families that access the family-sector shelter system as well as information on the demographic characteristics of families experiencing homelessness from the 2018 Street Needs Assessment (SNA).

Limitations

This indicator does not include families who may be experiencing hidden homelessness which may include families who are temporarily living with someone because they do not have access to stable housing. These families are considered “hidden” because they may not be interacting with housing services and supports even though they are inadequately housed.

Lifelong Learning
Main
Active in Child's Education
Caregiver Learning & Education
Public Library Usage

Lifelong Learning

Families have equitable access to learning and training, and are active in their children’s education.

There are many types of learning

Learning can happen through formal education, such as certificate or degree programs from recognized institutions or through non-formal learning such as workshops, conferences, community courses, or recreation programs. It can also occur informally, through self-directed or tacit learning (for example, socialization or on-the-job learning).

The importance of lifelong learning

Lifelong learning can improve one’s socio-economic circumstances, such as improving one’s level of education, or supporting a career move. Participation in lifelong learning can also be important for an individual’s personal development – to give someone a sense of control over their life, and a sense of purpose and accomplishment. For many, lifelong learning should be seen as a public good which contributes to effective and informed participation in social and political life.

Participation in their children’s education

Every family member will place their own value on learning, and may value certain forms of learning over others. That said, family members can play an important role in supporting each other’s individual learning goals. For example, research shows that children do better in school when parents or caregivers are involved in their education and learning. Parental involvement can include many things, such as: reading to their children, helping with homework, or volunteering with

Parents helping with homework

What is it?

Parents helping with homework is based on parents of TDSB students (grades K to 6) who reported how often they helped with their child’s homework during the current school year.

Limitations:

One potential limitation of this indicator is that the question on which it is based may have been interpreted as how often that individual parent has helped with homework, whereas a second parent or caregiver may have helped the child with homework. Additionally, some parents may have acquired tutoring supports for their child, which may not be captured in this indicator.

Parent involvement in school activities

What is it?

Parent involvement in school activities is based on parents of TDSB students (grades K to 6) who reported how often they are involved in school activities. Involvement in school activities includes: (1) communicated with your child’s teachers or with the school (e.g., through telephone, email, your child’s school agenda); (2) attended parent/teacher interviews; (3) attended meetings and events at the school; or (4) volunteered at the school. Parent responses to each type of school involvement are also reported separately.

Limitations:

Since the Parent Census for parents of K-6 students was conducted in April 2017, this did not capture parents who participated in one of the school activities after April 2017 until the end of the school year. Moreover, the questions on which this indicator was based may have been interpreted as that individual parent’s involvement whereas a second parent or caregiver may have participated in school activities. As a result, this indicator may underreport the true level of parent involvement in school activities.

Caregiver level of education

What is it?

Caregiver level of education is based on the 2016 Statistics Canada Census question about level of education. This indicator looks at the percentage of families with at least one parent/caregiver that does not have a high school diploma.

Limitations:

This indicator may not accurately capture the degree of education of caregivers as it is based on a hierarchy that assumes that they have completed the previous levels of education listed in the question. For example, a caregiver with a trades certificate may not have received a high school diploma.

Child library use

What is it?

Child Library Use is based on Toronto Public Library administration data. Current child cardholders are defined as anyone who is aged 0-12 and registers with a Toronto postal code. Checkouts by children is based on physical library checkouts made in the past year by current child cardholders. Circulation of children’s materials is based on physical library checkouts of children’s materials (as coded by the library) by any current cardholder, regardless of age.

Limitations

Attendance for programs and use of some library services do not require a library card. Some children may be using these services without receiving a library card. Further, some children may not have their own library card but may be reading and using materials from the library taken out on their parent’s card. Checkout and circulation data included in this indicator is based on physical checkouts and does not include e-circulation.

Financial Security

Financial Security

Families have material well-being and an equitable standard of living.

Low-income impacts well-being

Income is one of the strongest predictors of well-being. Level of income shapes overall living conditions, including health-related behaviours such as quality of diet, physical activity, and substance use, as well as other factors such as: food security, housing, and other basic prerequisites of well-being.

Financial security is an important outcome

The antidote to low-income is financial security. Financial security refers to “an assured and stable standard of living that provides individuals and families with a level of resources and benefits necessary to participate economically, politically, socially, culturally, and with dignity in their community’s activities”. Financial security is an important outcome in itself because it supports and affects all other aspects of well-being.

Two aspects of financial security

This outcome attempts to capture both aspects of financial security – the material aspect and the relative aspect. “Material well-being” focuses on material needs that all people require to sustain a decent standard of living, such as food, clothes, shelter and transportation. An “equitable standard of living” focuses on the relative aspect of financial security, and the impact that inequality has on the well-being of individuals and society as a whole.

Unemployment

What is it?

Unemployment is based on the Statistics Canada 2016 Census unemployment rate. This rate is expressed as a percentage of the labour force. Unemployment refers to persons who were without paid work, were available for work and had actively looked for paid work in the past four weeks.

Limitations:

Unemployment rates reflect what is happening in employment and the labour force. The labour force can reflect a number of factors including social, demographic and economic factors that can influence this number.

Families on Ontario Works

What is it?

Families on Ontario Works is based on TESS caseload data from May 2018. This data describes the number, family composition, and length of time on assistance of families with children under 12 who are in receipt of Ontario Works in Toronto.

Limitations:

Note that the number of families in receipt of Ontario Works (OW) does not represent the total number of individual members or children who are in receipt of OW. Additionally, these data only represent cases that have applied to OW as a family. It is possible that people who participate in Ontario Works as singles without dependents may have children who did not apply to OW with them (e.g., refugee claimant who arrived in Canada without his/her family; applicant whose child is under custody of another parent; etc.). Also note that the duration on OW may not include previous spells on OW from other jurisdictions or other points in time.

Low-income families

What is it?

Families Living in Low-Income Households is based on the percent of families with children aged 0-12 living below the Low-Income Measure – After Tax (LIM-AT), which includes households with an after-tax income that is less than half the median income for all households, adjusted for family size. In 2016, the LIM-AT for a family of four was $44,266.

Limitations

The Low-Income Measure is a relative measure of poverty, and does not capture conditions of absolute or material poverty that many families in Toronto experience. Further, income is only one aspect of a family’s financial conditions that impact children’s well-being, and does not account for debt, assets and savings.

Students worrying about financial matters

What is it?

Students worrying about financial matters is based on TDSB students (grades 7 to 8) reporting how often they worry about their family’s financial situation.

Limitations:

This indicator is not a measure of actual economic status or financial strain as not all students would be aware of their family’s financial situation.

Core housing need

What is it?

Core Housing Need is based on the Statistics Canada 2016 Census definition of core housing need which is created in collaboration with the Canada Mortgage and Housing Corporation (CMHC). This indicator looks at the percentage of families who fall under core housing need defined as a family whose dwelling is considered unsuitable (not enough bedrooms), inadequate (requireing major repairs) or unaffordable (shelter costs greater than 30% of household income) and whose income levels are such that they could not afford alternative suitable and adequate housing in their community.

Limitations:

There are a few important limitations to consider when working with the ‘core housing need’ indicator. Families who may be experiencing homelessness or transient housing may not be captured in this indicator. Further, if the caregiver or caregivers are between age 15-29 and are attending school full-time, the family would not be considered to be in core housing need as their housing situation is seen as temporary.

Community & Culture

Community & Culture

Families belong to communities, and have the freedom to express, and opportunities to foster, their culture and identity.

Community belonging contributes to well-being

Strong communities are built on strong social bonds, which help create social stability and cohesion, and contribute to individual well-being. Community belonging can provide protection against social isolation (a pervasive lack of social interaction), social exclusion (being denied the opportunity to participate in social life), and can contribute to resilience.

Defining community can be difficult

The term “community” holds different meanings for different people. Community can refer to: a neighbourhood; a cultural, religious or other identity group; or an extended social network of family and friends. Each family and child will identify to a greater or lesser extent with each form of community, which may change over the course of their lives.

Fostering culture and identity

Some communities, especially cultural minority groups, may face marginalization, stigmatization, and loss or devaluation of language and culture. For those communities, the ability to practice, express, foster and develop their cultural traditions and language is an important aspect of their well-being, and the opportunities to do so must be available and accessible to children and families, including through services and programs.

Caregiver sense of community belonging

What is it?

Caregiver sense of community belonging comes from the Canadian Community Health Survey (CCHS) question “How would you describe your sense of belonging to your local community?”. The responses included very weak, somewhat weak, somewhat strong, and very strong which were regrouped to somewhat/very weak and somewhat/very strong for reporting.

Limitations:

As a result of the 2015 redesign, the Canadian Community Health Survey (CCHS) has a new data collection strategy, a new sampling design, and has undergone major content revisions. With all these factors taken together, caution should be taken when comparing data from previous cycles to data released for the 2015 cycle onwards. A person’s sense of belonging may change from day to day based on mood, current events, daily interactions and much more. Sense of belonging information is self-reported. Self-reported data have a number of limitations. People may under-report or over-report certain behaviours or characteristics based on their perceived social desirability. Due to the small sample size of caregivers in the CCHS, most socio-demographic stratifiers could only be reported as binary variables to ensure reportability.

Student participation in cultural activities

What is it?

Student participation in cultural activities is based on parents of TDSB students (grades K to 6) reporting how often their child took part in cultural group, faith/religious activities outside of school (not part of school).

Limitations:

Expression of culture is dependent on the student or family’s unique circumstances and practices. Consequently, there is potential for under reporting on participation in cultural activities if students or parents do not perceive certain activities to be cultural or the cultural element is not the primary focus of the activity. For instance, cultural groups may organize or host cooking classes, sport instruction, nature walks, music/dance/the arts, etc., which may not be recalled as a cultural activity, but may embed cultural or faith-based aspects.

Student participation in volunteer activities

What is it?

Student participation in volunteer activities is based on TDSB students (grades 7 to 8) reporting how often they took part in volunteer activities outside of school (not part of school).

Limitations:

One potential consideration when interpreting this indicator is that responses may include volunteering to support a family-run business along with volunteering with community organizations or non-profit organizations.

Parent discomfort at school because of identity

What is it?

Parent discomfort at school because of identity is based on TDSB parents (with students in grades K to 6) who reported feeling uncomfortable at their child’s school because of at least one of the following personal characteristics: (1) appearance (e.g., their clothing, etc.); (2) disability; (3) faith/religion; (4) gender identity; (5) level of income; (6) racial/cultural background; or sexual orientation. Parent responses for each personal characteristic are also reported separately.

Limitations:

This indicator asks about parent discomfort while at their child’s school, which may be interpreted by some respondents as negative experiences while on the school premises. Negative interactions with teachers or school staff through email, phone, or other means of communication off premises may not necessarily be captured here.

Teachers respect student backgrounds

What is it?

Teachers respect student backgrounds is based on TDSB students (grades 7 to 8) who responded how many of their teachers respect their background (e.g., cultural, racial, religious).

Limitations:

The specific aspect of the student’s background is not specified in this question so it is not possible to tell whether certain personal characteristics are more or less respected than others

Differences among all people are respected at school

What is it?

Differences among all people respected at school is based on parents of TDSB students (grades K to 6) who reported how often they felt that in this school, differences among all people are respected.

Limitations:

The source of difference is not specified in this question so it is not possible to tell whether certain personal characteristics (e.g., race, sexual orientation, gender, age, physical ability, etc.) is more or less respected than others. Moreover, if parents are not actively engaged in their school, they may not have a full appreciation for how differences among individuals are treated.

Opportunities for students to express their culture

What is it?

Opportunities for students to express their culture is based on TDSB students (grades 7 to 8) who reported that they had opportunities to express their cultural identity at school.

Limitations:

This indicator does not account for the degree in which student’s feel they are able to express their culture. Student’s may feel they can express certain aspects of their culture but not others. Similarly, some students may have multiple cultural identities – some of which they feel they have the opportunity to express and others less so.

Opportunities for students to learn about their culture

What is it?

Opportunities for students to learn about their culture is based on TDSB students (grades 7 to 8) who reported that they had opportunities to learn about their own cultural/racial background at school.

Limitations:

This indicator does not specify whether the learnings occur through the curriculum or through teachers and/or peers at school. If students interpreted this question as learning about their culture in the classroom as part of a formal lesson, it may omit opportunities to learn about culture through more informal means (e.g., conversation with friends).

Self Knowledge

Self Knowledge

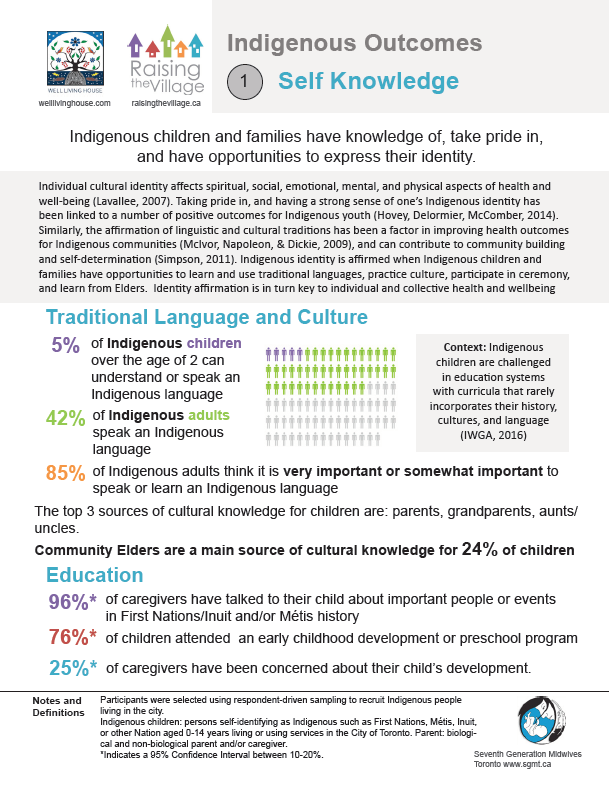
Indigenous children and families have knowledge of, take pride in, and have opportunities to express their identity.

Individual cultural identity affects spiritual, social, emotional, mental, and physical aspects of health and well-being (Lavallee, 2000). Taking pride in, and having a strong sense of one’s Indigenous identity has been linked to a number of positive outcomes for Indigenous youth (Hovey, Delormier, McComber, 2014). Similarly, the affirmation of linguistic and cultural traditions has been a factor in improving health outcomes for Indigenous communities (McIvor, Napoleon, & Dickie, 2009), and can contribute to community building and self-determination (Simpson, 2011). Indigenous identity is affirmed when Indigenous children and families have opportunities to learn and use traditional languages, participate in cultural ceremonies, and learn from Elders. Self-knowledge through the acquisition of language, spirituality and culture are key protective factors that support the individual’s social and emotional well-being.

Strong Families

Strong Families

Indigenous families, including all generations, are able to cope with challenges, meet their goals, and foster their culture and identity.

“All my relations” is a concept that captures the broad way that family is defined within many Indigenous communities. It recognizes all the generations within a family – Elders, parents, aunties and uncles, children and grandchildren – and the unique roles they each play in supporting well-being. It also recognizes non-blood relations, and emphasizes the relationship between all people. It acknowledges the ancestors who have come before, the future generations who are not yet born, and can also include the spirits of the non-human world.

Families support well-being at the individual level by providing a source of strength for cultural identity and self-knowledge. Strong families are also the foundation for strong communities. When families are resilient and connected to their communities, they provide the foundation for healing from intergenerational trauma and the impacts of colonialism and racism. Programs and services should take a holistic approach to Indigenous families, and where possible, should engage children, parents, Elders and other members of the community together.

Vibrant Communities

Vibrant Communities

Indigenous communities are diverse, vibrant, growing, and connected, and provide a source of strength for children and families.

The Indigenous community in Toronto is diverse and comes from many different nations and regions. The final report of the Toronto Aboriginal Research Project (2011) identified community cohesion as an important aspect of strengthening communities and achieving positive outcomes at the community level. Because the Indigenous population is spread out across Toronto, and is very diverse in terms of economic status, cultural background, and service needs, finding ways to connect people to each other and to culturally appropriate services is an important aspect of building vibrant communities that can in turn provide a source of strength for families.

Cultural Equity

Cultural Equity

Indigenous children and families experience their cultural identity and way of being with dignity and respect.

Indigenous peoples have the right to express, practice, develop and foster their cultures and traditions (United Nations Declaration on the Rights of Indigenous Peoples, 2007). Cultural equity involves protecting Indigenous cultures, and supporting Indigenous people to practice their spiritual and cultural traditions. Indigenous children and families experience cultural equity when they are safe to practice and express their cultures, and when their rights are respected and fulfilled. Cultural equity must also involve the sharing of power between Indigenous and non-Indigenous communities.

In order to achieve cultural equity for Indigenous children and families in Toronto, non-Indigenous people must become culturally proficient in Indigenous culture. That is, they must be knowledgeable about Indigenous ways of being, knowing, and doing. This process must begin in the services and programs that Indigenous children and families access. Service providers must become culturally proficient through training and education, in order to have the skills, tools and attitudes that allow them to serve Indigenous children and families in a manner that is respectful and appropriate.

Self Determination

Self Determination

Indigenous communities are able to make decisions that improve the well-being of their children, families and communities as a whole.

Self-determination refers to the ability of communities to make important decisions about their governance, lives, and membership. In a policy context, self-determination means that Indigenous peoples are able to dictate the interventions that will produce positive health and well-being within their communities.

In July 2010, Toronto City Council adopted a Statement of Commitment to Aboriginal Communities in Toronto. This statement not only recognized the inherent rights of Indigenous peoples enshrined in Section 35 of the Canadian constitution, it also affirmed the City’s support for Indigenous self-determination.

Self-determination is expressed when:

  • Indigenous peoples and organizations make decisions about the services and programs that are needed to support the well-being of Indigenous peoples
  • Indigenous organizations have the financial resources required to provide adequate community services
  • Programs and services are rooted in Indigenous worldviews, culture and languages
  • Relationships between Indigenous and non-Indigenous peoples, organizations and governments are collaborative and respectful